Attention
You are using Internet Explorer. Content will likely not be displayed correctly. Please switch to a different Browser to use this site.
pgen/pgtatzeit:
| en | de | |
|---|---|---|
| -1 | [-1] No answer | [-1] keine Angabe |
| -2 | [-2] Does not apply | [-2] trifft nicht zu |
| -3 | [-3] Implausible value | [-3] unplausibler Wert |
| -4 | [-4] Inadmissable multiple response | [-4] unzulaessige Mehrfachantwort |
| -5 | [-5] Not included in this version of the questionnaire | [-5] in Fragebogenversion nicht enthalten |
| -6 | [-6] Version of questionnaire with modified filtering | [-6] Fragebogenversion mit geaenderter Filterfuehrung |
| -7 | [-7] Only available in less restricted edition | [-7] nur in weniger eingeschraenkter Edition verfuegbar |
| -8 | [-8] Question this year not part of survey | [-8] Frage in diesem Jahr nicht Teil des Frageprogramms |
| -9 | [-9] Missing due to a terminated interview | [-9] fehlend aufgrund eines abgebrochenen Interviews |
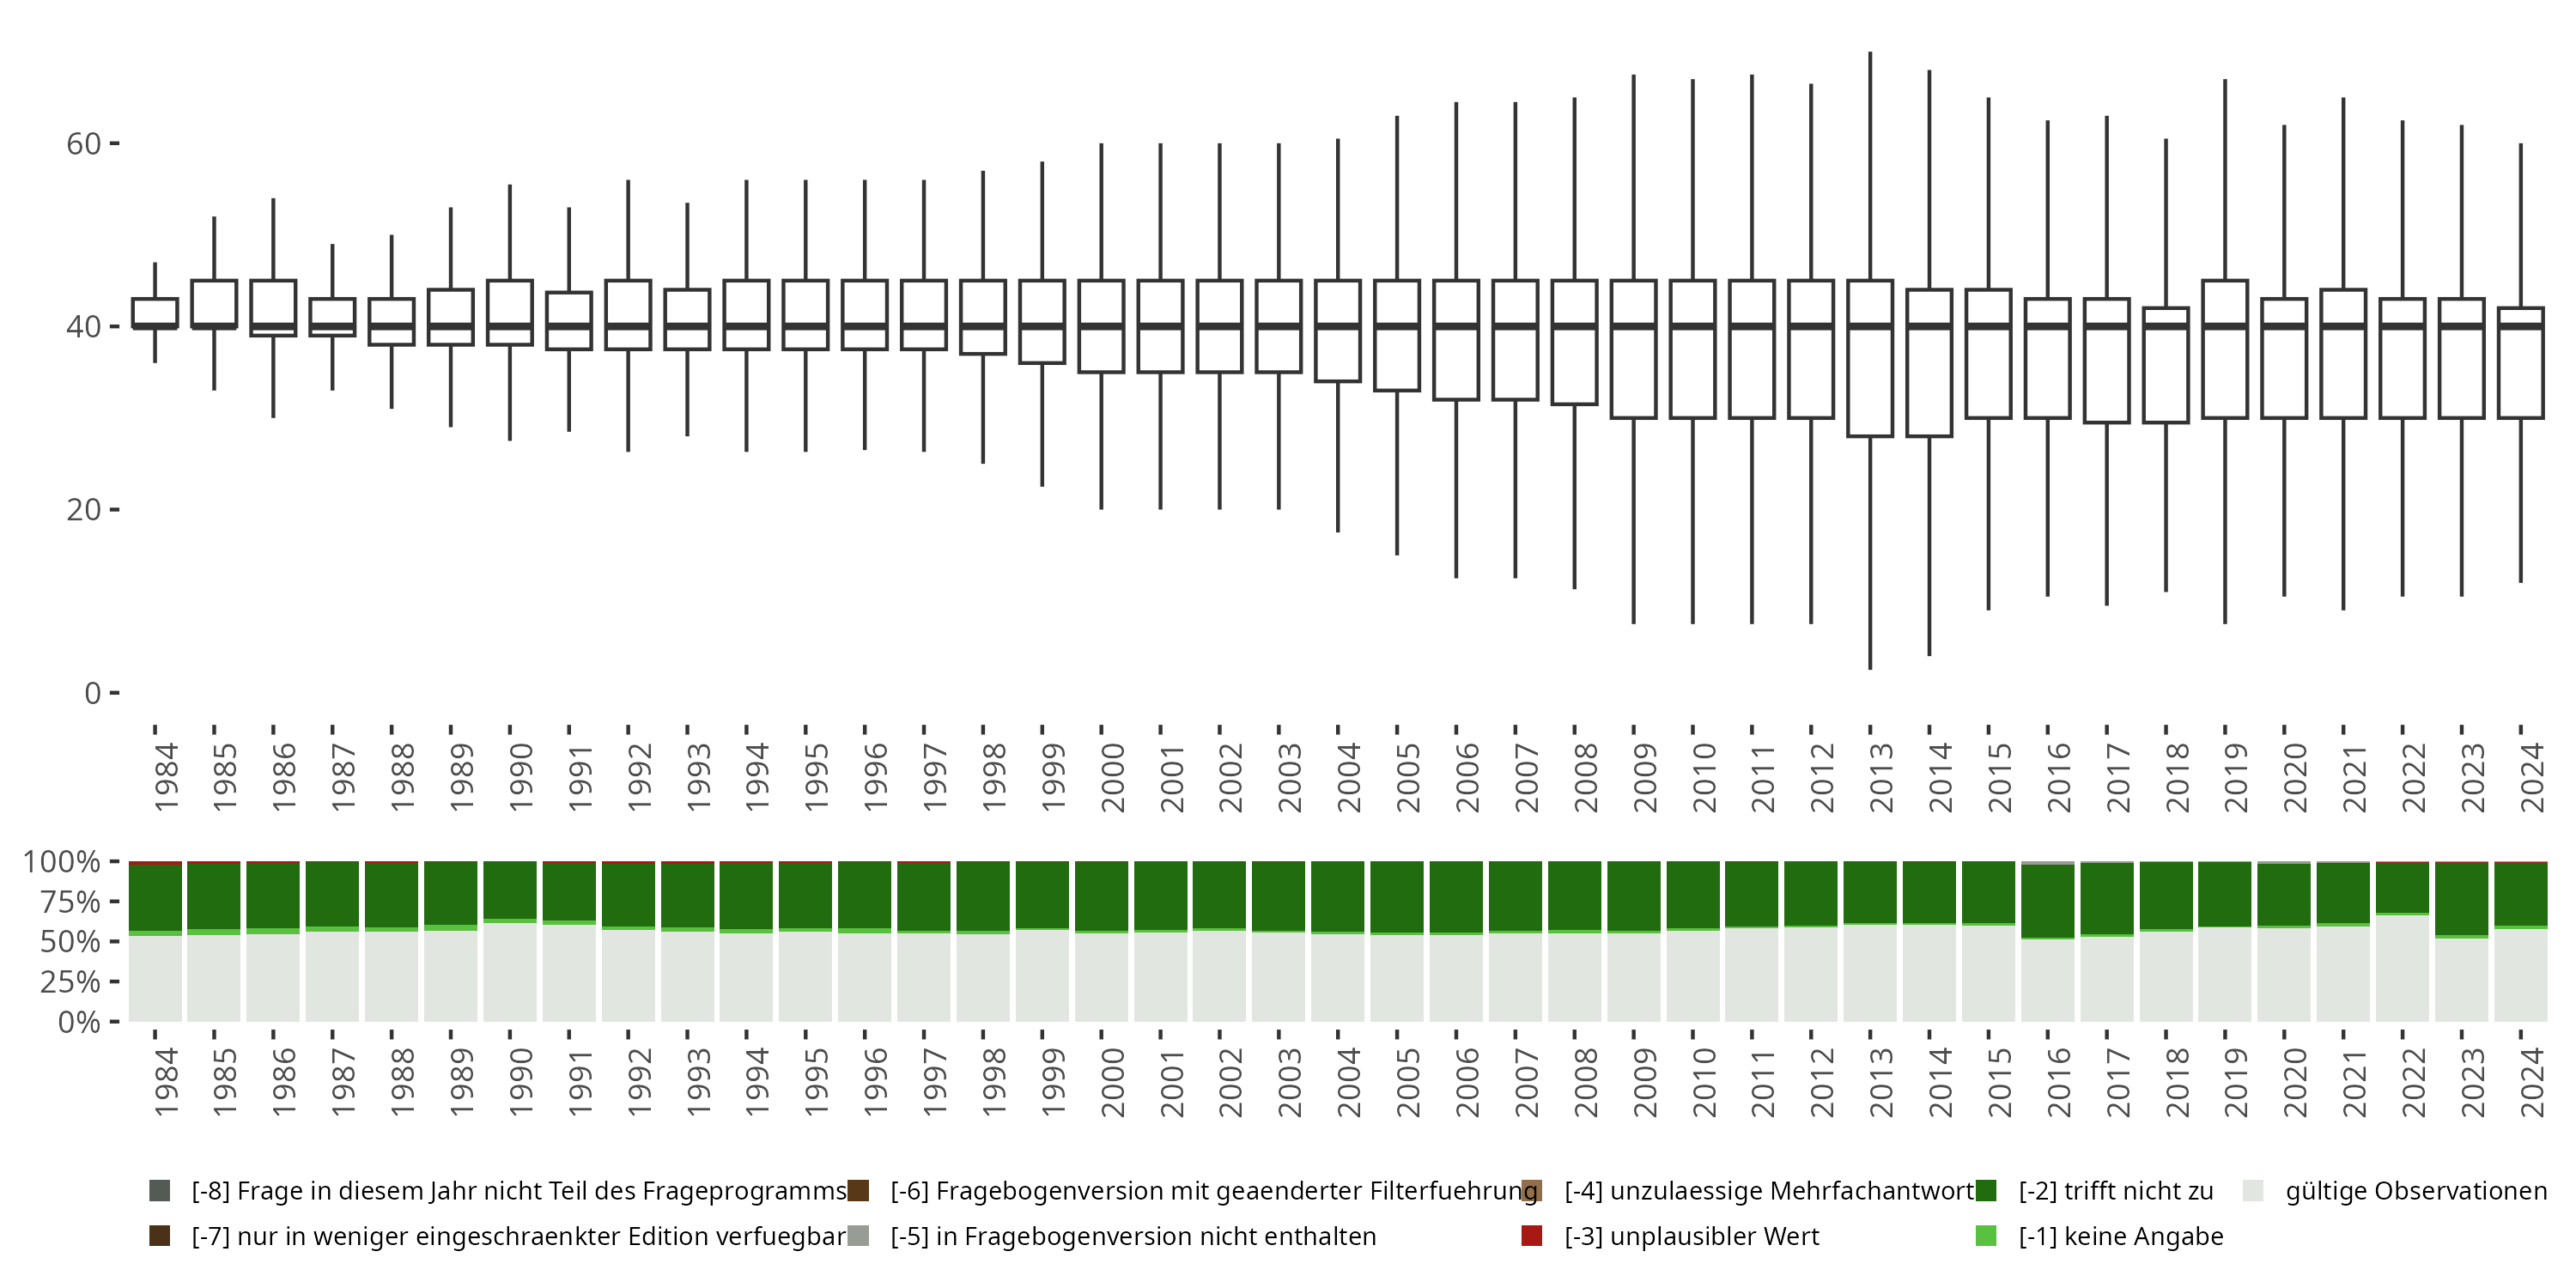
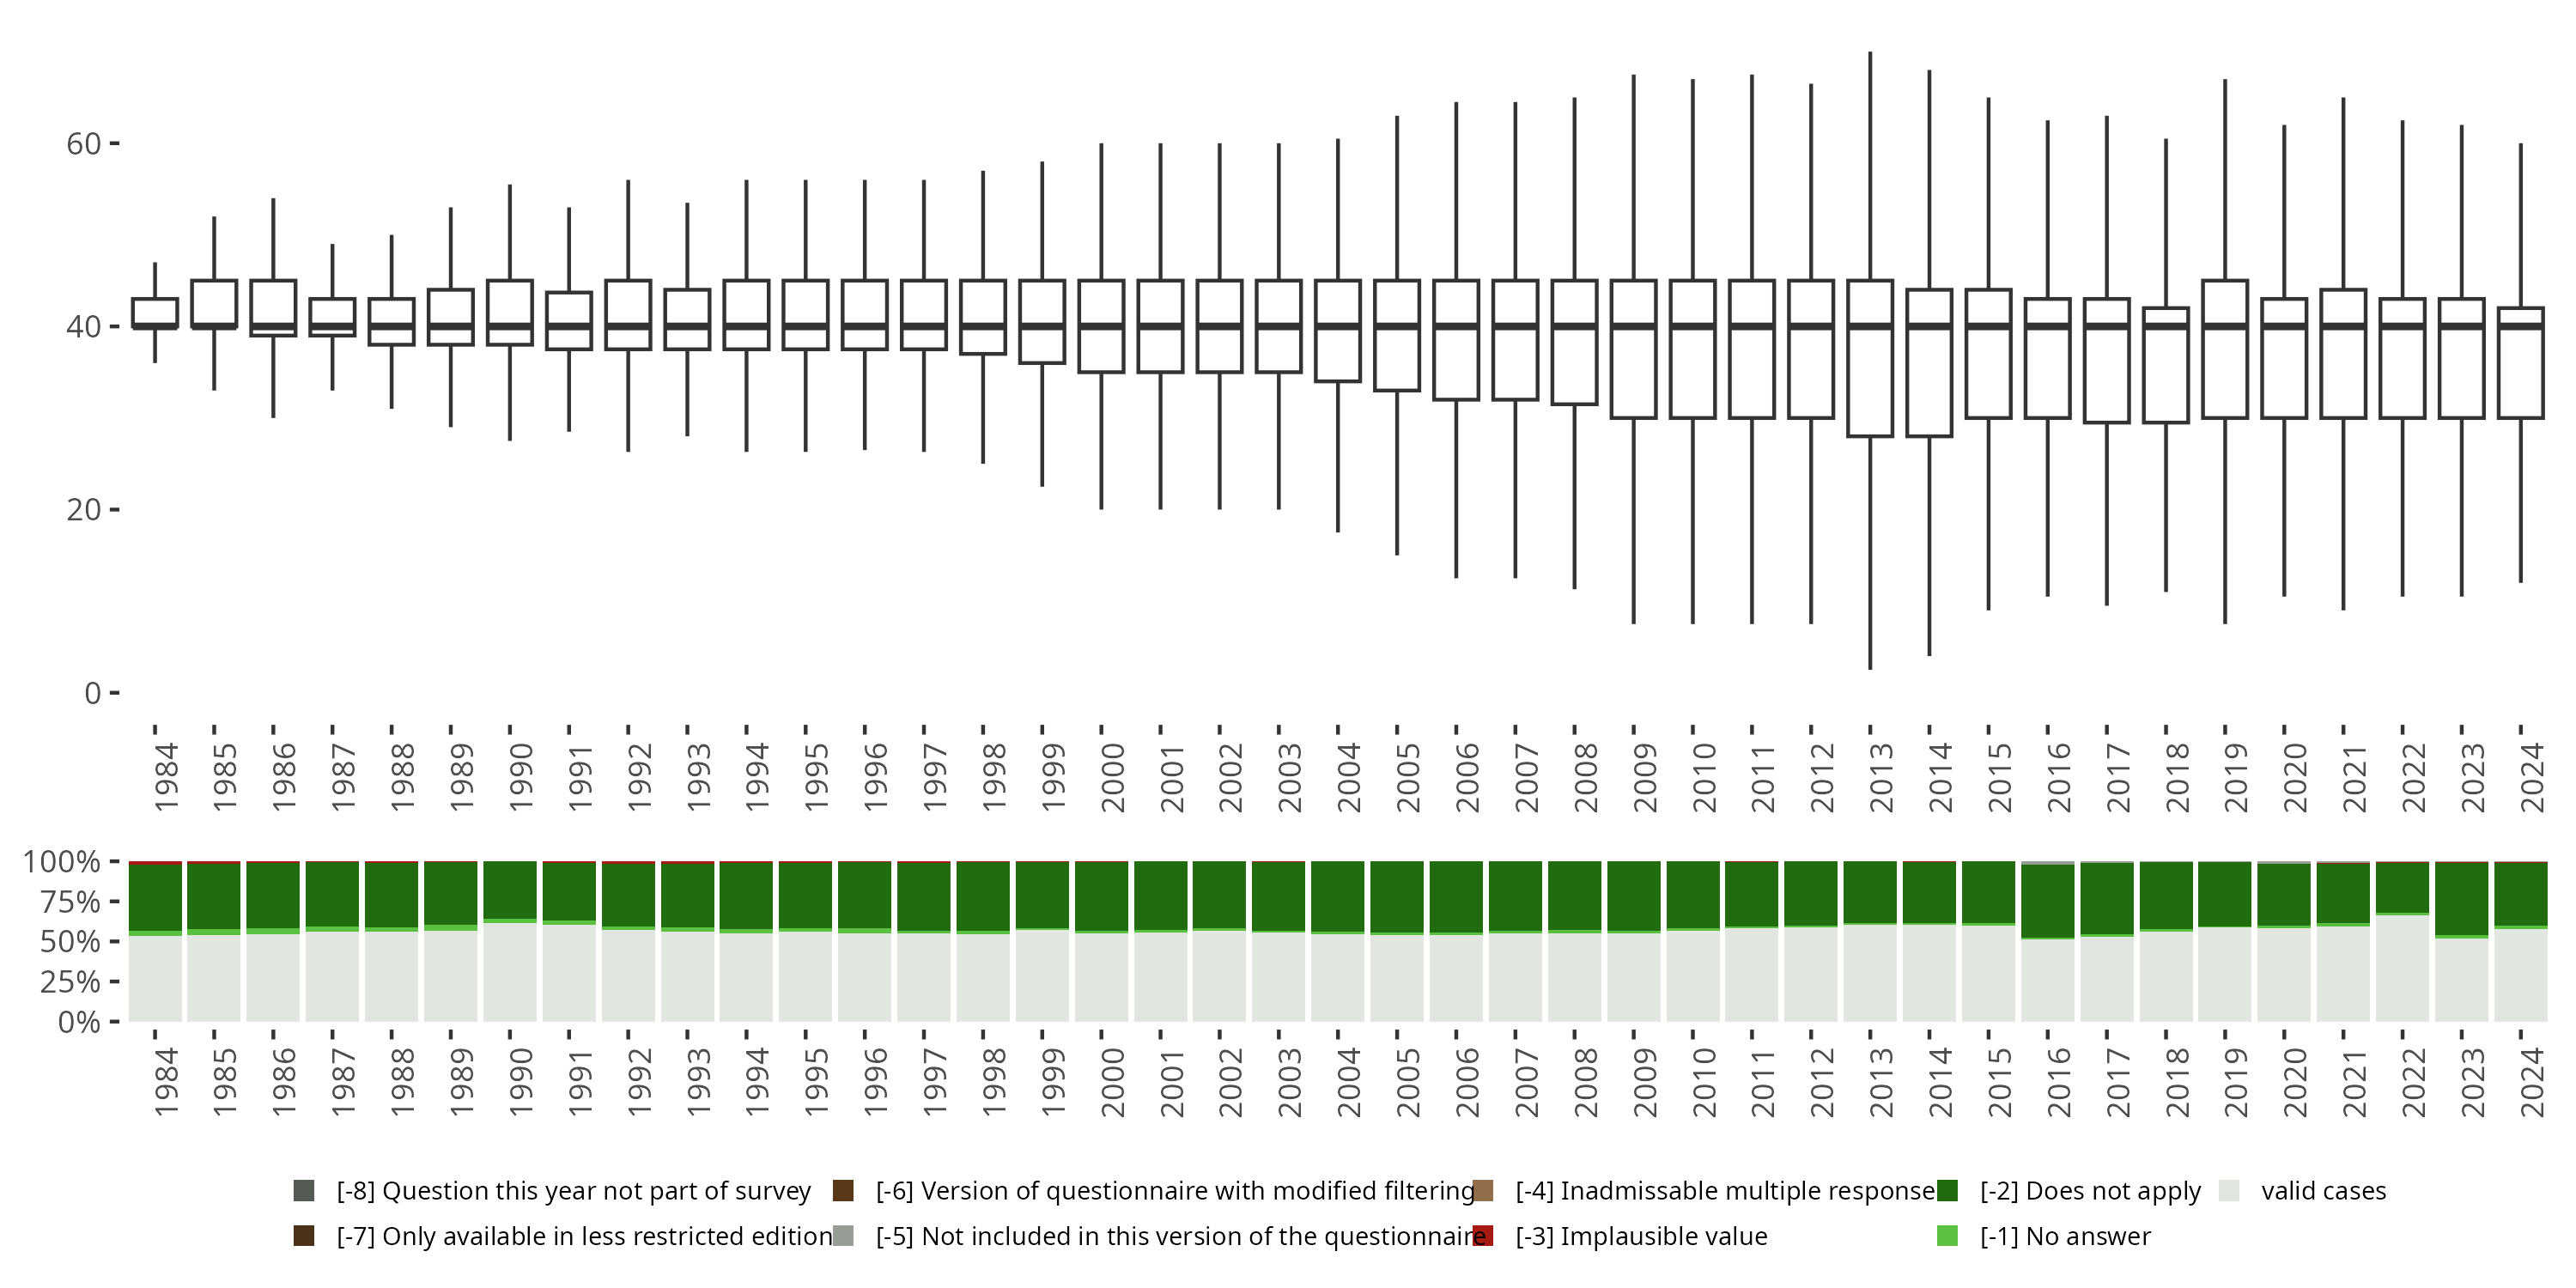
: Actual Work Time Per Week
: Tatsächliche Arbeitszeit pro Woche
pgen – Generated Individual Data
:
:
: multiple
:
| Measure | Value |
|---|---|
| Min. | 0.0 |
| 1st Qu. | 32.0 |
| Median | 40.0 |
| Mean | 37.50183868408203 |
| 3rd Qu. | 45.0 |
| Max. | 80.0 |
| valid | 484819 |
| invalid | 370247 |
Codes of related variables with the same concept
This table provides you with an overview of label definitions across related variables to identify changes over time in longitudinal variables. The first number indicates the value code, the second number (in brackets) represents the frequency in the data. Please note that labels are simplified and values with frequency = 0 are hidden.